How Cold Does It Have to Get Before Heating-Repair Searches Rise? We Compared 5 Years of Search and Weather Data
Quick answer
Furnace problems in cold weather do show up in Google searches, just less sharply than you might expect. In our analysis of five years of Google Trends search-interest data (not repair calls), colder weeks had only slightly more heating-repair searching: the correlation with the week’s low at Dulles was 0.21 for the DC metro and 0.29 for Virginia, so temperature explained less than 10% of the week-to-week swings. The two clearer signals were the first freezing week of fall, when interest rose in all five Virginia seasons, and the coldest weeks below 15°F, which averaged about twice the interest of weeks with lows in the 30s.
It’s the first frosty morning of the season. The furnace that sat quiet since March tries to start, and you wonder whether everyone in Northern Virginia is having the same trouble this week.
This isn’t a lab test or a computer model of a furnace. It’s a data analysis: we compared Google Trends search-interest data for four heating-repair phrases with NOAA temperature records from Washington Dulles International Airport, week by week, for five heating seasons. Google Trends shows relative interest, not the number of searches, and it says nothing about actual repair calls.
The timing matters right now. In each of the last 10 years, Dulles recorded its first fall low of 32°F or colder between October 21 and November 10, with a typical date around October 30. That’s also the week our data points to.
What we tested
Do searches about furnace problems in cold weather rise when the DC area turns cold, and how quickly? We matched weekly Google Trends data to the coldest temperature recorded at Dulles in the same week.
- Search phrases: “furnace repair,” “furnace not working,” “heat not working” and “heater repair,” compared together and averaged into one index (0–100)
- Places: the Washington DC metro area (Google’s DC market, which includes Northern Virginia) and the state of Virginia
- Period: 261 weeks, late September 2021 to September 2026, including 131 weeks from October through March
- Tests: same-week link, one-week delay, week-to-week change, interest by temperature range, and the first freezing week of each fall
- Result type: search-interest data and historical weather observations, not search volume and not repair calls
How we compared searches and weather
Google Trends scores each week from 0 to 100, relative to the busiest week in the chosen place and period. It uses a sample of searches, and phrases with too few searches show as 0. A score of 10 doesn’t mean 10 searches.
| Input | Source | What we used |
|---|---|---|
| Search interest | Google Trends, 5-year weekly view | Four phrases compared together; average of the four scores each week |
| Places | Google Trends geographies | DC metro (includes Northern Virginia) and Virginia, analyzed separately |
| Weather | NOAA GHCN-Daily, Dulles Airport (USW00093738) | Daily lows and highs, grouped into the same Sunday–Saturday weeks as Trends |
| Heating season | Our definition | October through March (131 weeks) |
| First freeze dates | NOAA GHCN-Daily, Dulles | First fall low of 32°F or colder, 2016–2025 |
For each week we took the coldest daily low at Dulles. Then we checked the correlation between search interest and that low (0 means no relationship, 1 a perfect one), the same check against the previous week’s low, whether weeks that turned colder also saw interest rise, and how interest changed in the first freezing week of each fall compared with the four weeks before.
Results: furnace problems in cold weather in the search data
Every number here is search-interest data about furnace problems in cold weather, not a count of broken furnaces. A positive correlation means colder weeks tended to have higher interest.
| Test | DC metro | Virginia | What it means |
|---|---|---|---|
| Same week: interest vs. the week’s low | 0.21 | 0.29 | Weak link; temperature explains about 4% (DC) to 8% (VA) of the swings |
| Same week: interest vs. the week’s average temperature | 0.15 | 0.22 | Even weaker |
| One-week delay: interest vs. last week’s low | 0.15 | 0.18 | No sign that searches trail the cold by a week |
| Week got colder vs. interest went up | 0.26 | 0.30 | Sudden drops line up a little better than the temperature itself |
| Coldest weeks (below 15°F) vs. weeks in the 30s | 1.9× higher | 1.9× higher | Clearest temperature effect, from 19 very cold weeks |
| First freezing week vs. the 4 weeks before | Up in 4 of 5 falls | Up in 5 of 5 falls | Typical rise of about 3 to 5 points |
| First week at 25°F or colder vs. the 4 weeks before | Up in 3 of 5 falls | Up in 4 of 5 falls | Inconsistent |
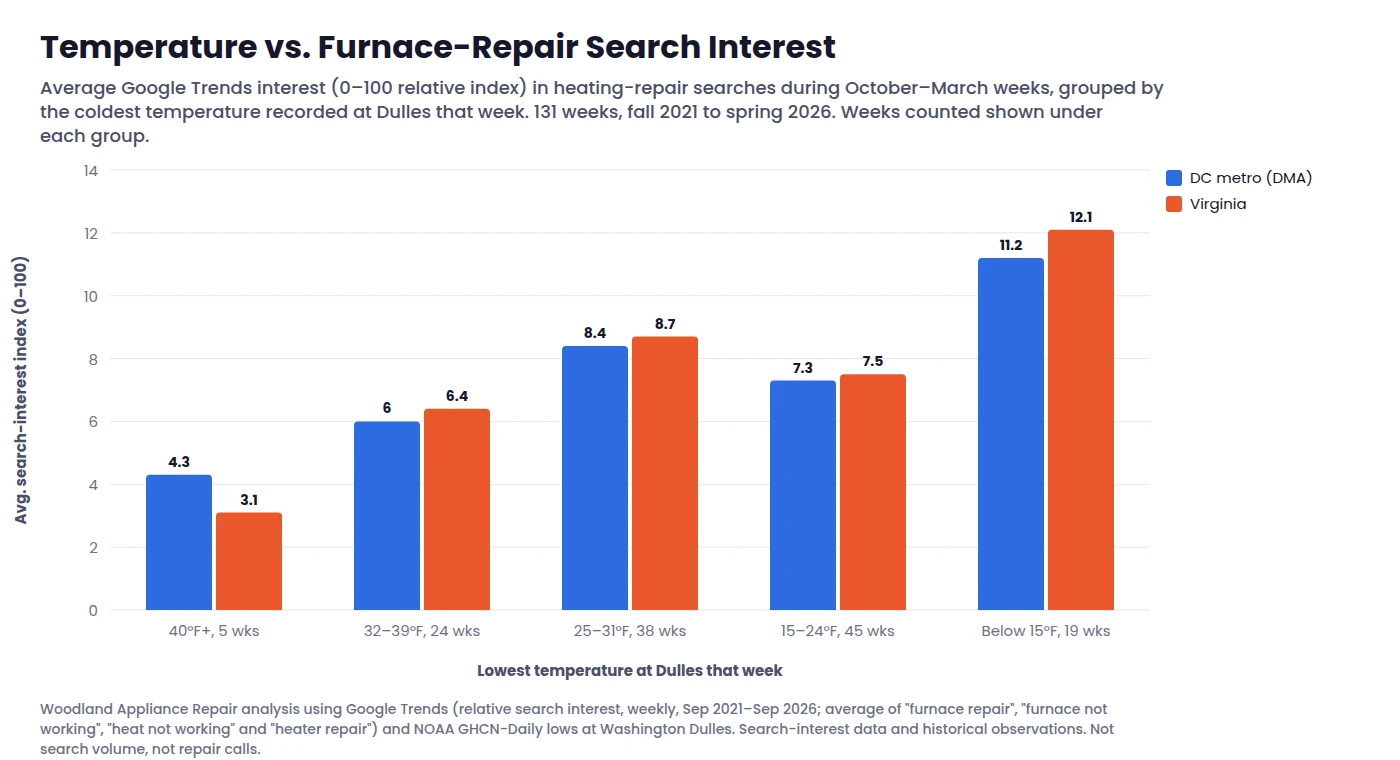
Graph 1 groups the 131 October-to-March weeks by how cold it got at Dulles. Interest roughly doubles from weeks with lows in the 30s to weeks that dipped below 15°F. But the steps aren’t smooth: weeks with lows between 15°F and 24°F averaged a little less interest than weeks between 25°F and 31°F. Only five heating-season weeks stayed at 40°F or warmer, so that bar rests on very little data.
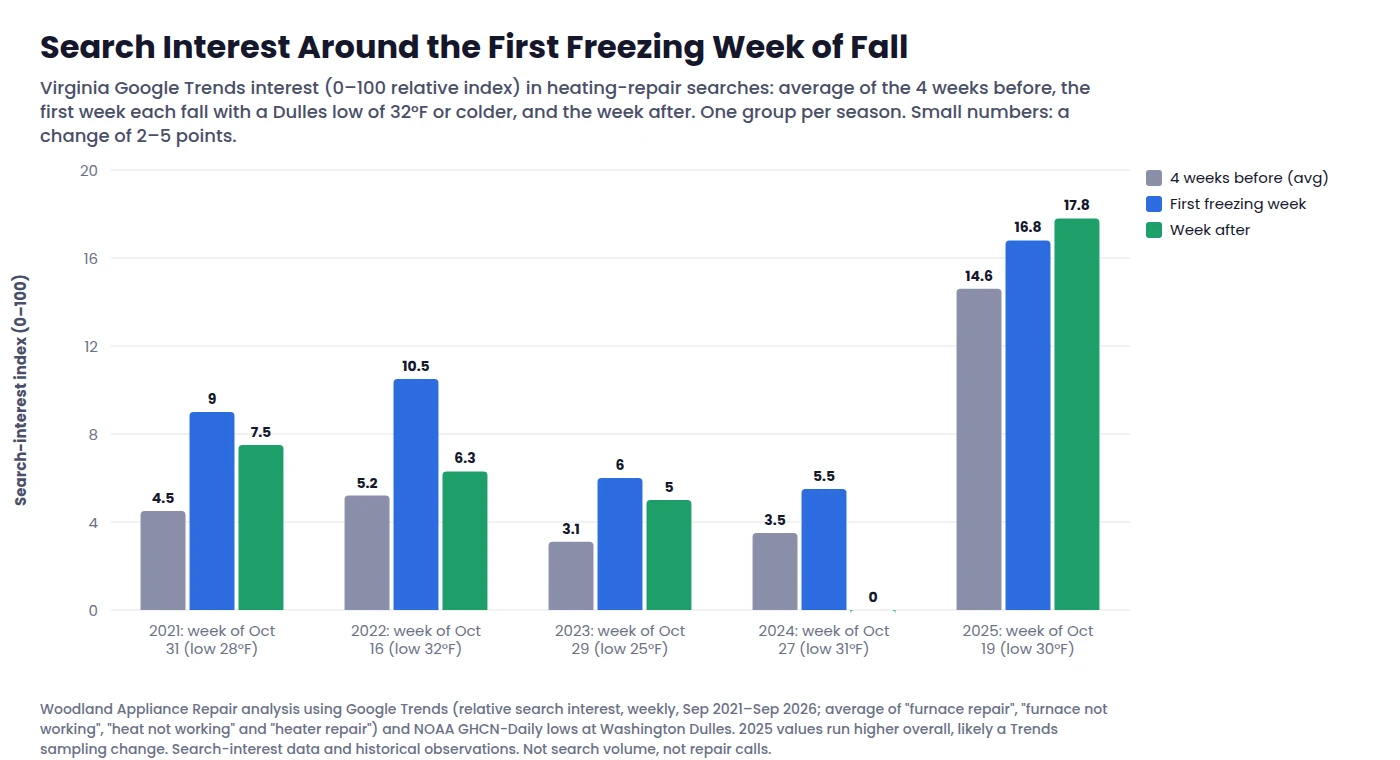
Graph 2 zooms in on the first freezing week of each fall in Virginia. In every season, interest that week was higher than the average of the four weeks before it, and it usually eased again the week after. The rises are small, though: 2 to 5 points on a 0–100 scale. In the DC metro the same pattern held in four of five falls. In fall 2024 the DC numbers were too sparse to show anything: the freeze week and the week after both read 0.
Why the search data on furnace problems in cold weather is so noisy
Three things blur the picture.
- Sparse local data. These phrases don’t get enough searches in one metro area for Trends to report every week. From September through November 2024, 10 of 13 weeks in the DC metro read 0.
- Season, not just temperature. Interest kept climbing through winter. In March 2025 the DC metro averaged 16.1 even though weekly lows were back in the 20s and 30s, higher than any week from September through November 2024. Searching seems to build over the season, so cold weeks and late-winter weeks are hard to separate.
- Changes in the data itself. Values from mid-2025 onward run higher across the board, likely a change in how Trends samples or scales. That lifts the 2025 bars in Graph 2 and inflates monthly averages, so we didn’t lean on the monthly pattern.
The phrases also behave differently. In the 5-year Virginia view, “no heat” and “heat not working” peaked in January, while “furnace repair” and “heater repair” peaked in June and July.
What this means for your home
Search data can’t predict furnace problems in cold weather in your own house. What it does show is when heating trouble becomes top of mind across the region: the first freezing week, usually in late October or early November, and the deep cold of January. Here’s how we’d use that:
- Test the heat before the first freeze. Run the furnace on a mild afternoon in October. A burning-dust smell for the first few minutes is common after a summer off. A smell that doesn’t fade, a burner that clicks but won’t light, or cold air from the vents are worth a call.
- Change the filter. The Department of Energy notes that a dirty or clogged filter can dramatically reduce airflow, increasing run time and wear on the motor.
- Expect longer run times on cold days. A furnace that runs longer at 15°F than at 40°F is usually doing its job, because the house loses heat faster. Short, frequent cycling or no heat at all is a different story, and those are the furnace problems in cold weather worth a call.
- Check the thermostat. Dead batteries or a wrong mode setting can look like a furnace that won’t start. Our thermostat repair page covers the common faults.
If you’d rather have it checked, a $99 heating tune-up before the first cold week catches many of the small faults that turn into furnace problems in cold weather. If the heat is already out, see our furnace repair and heat pump repair pages.
Where these results could differ
- Other phrases: we analyzed four phrases averaged together. A single phrase, such as “no heat,” may track winter more closely.
- Other places: colder regions with more searching may show a stronger link. Virginia-wide data was a little stronger than the DC metro alone.
- Longer history: the original plan called for 10 years. Google Trends only gives weekly data for up to five years, so we used five seasons for the weekly comparison and 10 years only for first freeze dates.
- Searches aren’t breakdowns: people search about furnace problems in cold weather for many reasons, including curiosity or comparing companies. A rise in interest doesn’t mean more furnaces failed, and this data can’t show that cold weather caused any failure.
Heating safety comes first
The U.S. Consumer Product Safety Commission advises having a professional inspect all fuel-burning heating systems, including furnaces, chimneys, flues and vents, each year. It also says carbon monoxide alarms should be placed on every level of the home and outside sleeping areas, because fuel-burning heaters can produce CO, an odorless, colorless and deadly gas. Test your CO alarms when you turn on the heat for the season, and don’t try to fix gas furnace problems in cold weather by opening up the burner or gas valve yourself.
If you smell gas, Washington Gas says to leave the area, move to a safe location, call 911 and then call its emergency leak line. Don’t light a flame or operate switches on the way out.
Furnace problems in cold weather? We can help
We can usually be there the same day across Prince William and Fairfax counties. Use code FREECALL and the service call is free with your repair.
From our technician
We asked Nick when furnace problems in cold weather start showing up in his calls.
“I’d put the first noticeable jump in furnace calls around the second half of October. That’s when people who hadn’t really run the furnace yet start turning it on overnight. When we get down around freezing toward the end of October, it jumps again, because now the system is running for real.
On a mild fall day we’re looking at around 3 to 5 heating calls. During the first real cold snap, that can easily double.”
Nick, Senior Technician, EPA-certified, experience since 2008
Furnace repair in Northern Virginia
Late October and early November, when Dulles sees its first freezing nights, is when many furnaces run for the first time since spring. Woodland handles furnace repair across Prince William, Fairfax, Loudoun and Fauquier counties, plus Arlington and Alexandria. We’re based in Woodbridge, so Woodbridge, Manassas, Dumfries and Lorton are usually same-day calls, and we’re in Fairfax, Centreville, Springfield, Arlington and Alexandria every week. See our furnace repair page or call (703) 335-1009.
Sources and methodology
Methodology: we averaged the four phrases’ weekly Trends scores and matched each Sunday–Saturday week to NOAA daily records at Dulles (weeks with at least five days of data). Correlations are Pearson correlations over the 131 October–March weeks.
Limits: neighboring weeks move together, so the correlations look more certain than they are. Trends values change if the window or phrase list changes. We had no repair-call data, and this analysis can’t show cause and effect.
Check: we recomputed the fall 2024 first-freeze figures for the DC metro by hand from the weekly series and they matched the summary values.
- Google Trends — weekly relative search interest, 5-year view to September 2026, DC metro (DMA 511) and Virginia (search-interest data)
- Google Trends Help, “FAQ about Google Trends data” — how Trends samples and scales data, and why low-volume terms show as 0
- NOAA GHCN-Daily, Washington Dulles International Airport (USW00093738) — daily lows and highs, 2021–2026, and first fall 32°F lows, 2016–2025 (historical observation)
- U.S. Consumer Product Safety Commission, “Keep Warm and Safe This Winter” (Jan. 23, 2026) — annual inspection and CO alarm guidance
- U.S. Department of Energy, “HVAC Proper Installation of Filters” — dirty filter and airflow
- Washington Gas, natural gas safety — what to do if you smell gas
Safety note: Google Trends measures relative search interest, not actual repair calls or equipment failures. Any relationship between weather and searches is an observed association and should not be interpreted as proof of causation.
Important Disclaimer
This article is for general educational purposes and is based on virtual testing, simulations, data analysis, published research, and the assumptions described in the article unless a physical test is specifically stated. Results are estimates and may differ based on your home, equipment, installation, maintenance, weather, usage, and other conditions. Do not recreate unsafe conditions or rely on these results as a substitute for manufacturer instructions, official safety guidance, or advice from a qualified professional. Woodland Appliance Repair, LLC makes no guarantee that these results will apply to your specific situation and disclaims warranties and liability to the fullest extent permitted by law.
Need a repair? We can usually be there today.
Locally owned and operated in Woodbridge. Licensed & insured, EPA 608 certified, with 15+ years fixing appliances, heating and cooling across Northern Virginia. $69 service call, free with the repair.